ISO 50001:2018 places an explicit obligation on certified organizations to establish, document, and maintain an Energy Measurement Plan (EnMP). Clause 6.6 of the standard requires that measurement needs be determined, instruments be calibrated, and data be collected at intervals sufficient to demonstrate energy performance improvement against baselines. For most manufacturing organizations pursuing certification, assembling that evidence is the most time-consuming and underestimated part of the audit cycle.
Steam trap monitoring, when implemented continuously rather than through periodic manual walkthroughs, is one of the few measurement sources that simultaneously satisfies ISO 50001 evidence requirements and provides genuine operational value. This article explains the measurement hierarchy the standard expects, where steam trap telemetry fits into that hierarchy, and the practical difference between audit-ready data and the kind of walkthrough records that create compliance risk during a third-party audit.
What ISO 50001:2018 Actually Requires for Measurement
Clause 6.6 (Energy data collection) is the operative clause for measurement planning. It requires organizations to identify the significant energy uses (SEUs) — defined earlier in the standard via the energy review process — and ensure that the measurement system covers those SEUs with sufficient frequency and accuracy. The standard does not prescribe specific measurement methods or intervals; it requires that the measurement approach be appropriate to the significance of the energy use and documented accordingly.
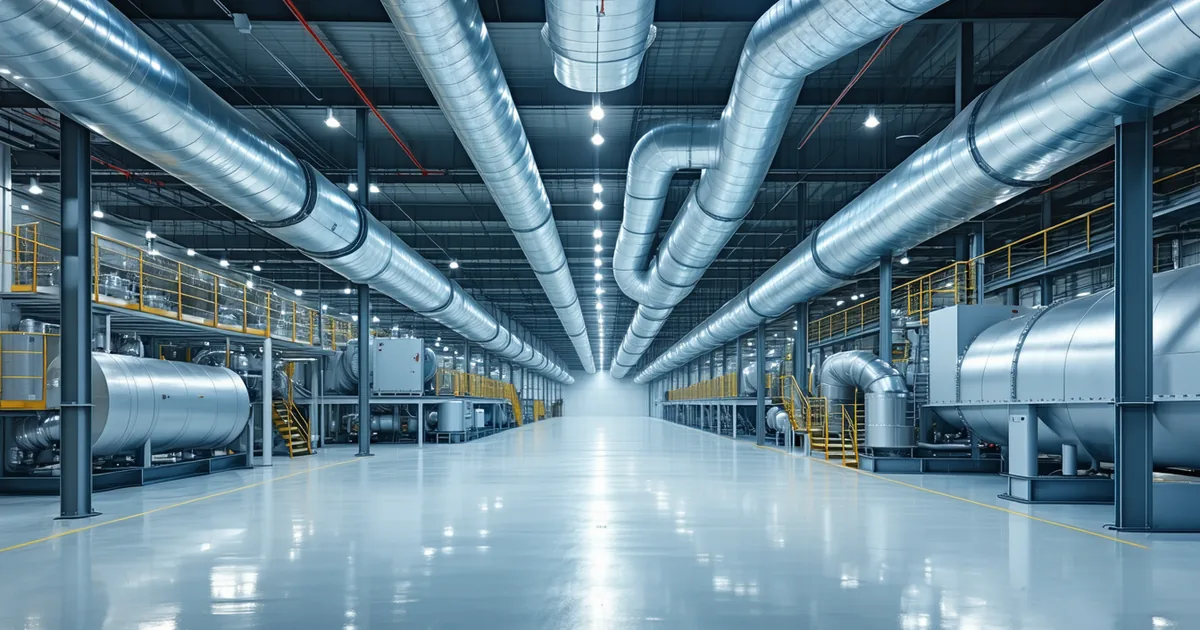
For a process plant where steam generation represents, say, 35–45% of total site energy consumption, the steam system is almost certainly an SEU. That designation carries an obligation: the measurement plan must cover steam generation input (gas or electricity to the boiler), steam consumption by major end-use points, and steam losses — which include distribution losses, condensate return losses, and trap failures. The last category is where most energy management programs have a gap.
Steam trap failures are typically invisible to a plant's existing metering infrastructure. A boiler meter measures fuel input. A steam flow meter on the main header measures gross steam production. But a failed-open steam trap — one that is passing live steam rather than condensate — reduces steam system efficiency without creating an alert or incrementing a meter. The energy disappears as vented steam, and the boiler compensates by running harder. The efficiency degradation is real; it simply lacks a measurement address in most plants' existing instrumentation architectures.
The Failure Modes: What You Are Measuring Against
Steam traps fail in two principal modes with opposite energy consequences:
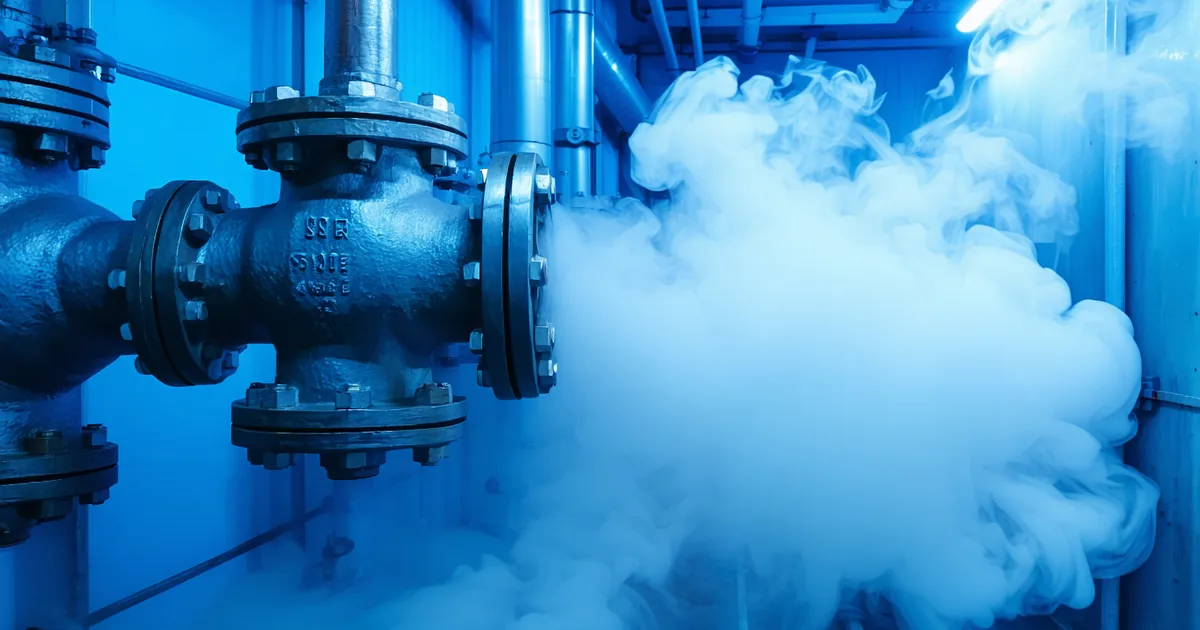
Failed open (blowing): The trap's mechanical mechanism (thermodynamic disc, float, bimetallic, or inverted bucket) fails in the fully open position. Live steam passes continuously through the trap into the condensate return line. Depending on trap size and operating pressure, a single failed-open trap can pass 15–300 kg/hour of live steam, representing 40–800 kWh/hour of energy content at typical industrial steam conditions (7–12 bar gauge, 170–190°C). A 30-trap installation with 10% failure rate — plausible in a plant running traps 8+ years without systematic inspection — loses approximately 1.5–5 GWh per year through blown traps alone.
Failed closed (blocked): The trap fails to open, causing condensate to back up into the steam system. This leads to waterlogging of steam equipment, reduced heat transfer efficiency, and in high-pressure systems, risk of water hammer. The energy consequence is indirect — reduced process efficiency rather than direct steam loss — but the production impact can be significant. A heat exchanger with blocked condensate drainage sees 15–30% reduction in heat transfer rate due to the condensate film effect.
A third quasi-failure mode is cold blowing: a trap that is passing condensate but at a rate and temperature inconsistent with the heat exchanger or jacketed vessel it serves. This indicates that the process equipment is not reaching target temperature, which means either the steam supply pressure is inadequate or the trap is undersized. Cold blowing cannot be detected by listening alone — it requires temperature monitoring upstream and downstream of the trap.
Telemetry vs. Walkthrough: What the Data Actually Looks Like
Traditional steam trap audits are conducted by maintenance technicians who move through the plant with a combination of ultrasonic listening devices and infrared thermometers or thermal cameras. A skilled technician can assess 20–40 traps per hour in favorable conditions. For a 120-trap installation, a full walkthrough takes 3–6 hours and produces a snapshot of trap condition at one point in time.
Continuous telemetry — typically acoustic emission sensors or temperature sensors mounted on the trap body, with data transmitted over a wireless mesh or wired to a monitoring gateway — provides a different kind of data: not a snapshot, but a time series. That time series reveals behavior patterns that a walkthrough cannot:
- A trap that blows steam for 20 minutes during morning plant startup (when steam pressure is rising) and operates correctly the rest of the day — a walkthrough during production hours would classify it as functional
- A trap that was repaired three months ago and has started to show the acoustic signature of a developing disc wear pattern, still within normal range but trending toward failure
- Seasonal variation: traps on outdoor condensate lines that fail more frequently in winter due to thermal shock on startup
For ISO 50001 purposes, the distinction matters at the evidence level. An auditor reviewing a Measurement Plan that includes continuous trap monitoring can see: the energy baseline established from trap condition data, the measurement frequency (continuous), the calibration records for the sensor hardware, and the improvement actions taken when trap failures were identified. That evidence chain satisfies Clause 6.6's documentation requirements in a way that a notebook of annual walkthrough observations does not.
Building the ISO 50001 Evidence Chain from Trap Data
The practical workflow for using trap telemetry as ISO 50001 evidence involves four stages:
1. Baseline establishment: The initial 30–60 day monitoring period establishes the baseline trap condition profile — how many traps are in each status category, the aggregate steam loss estimate from failed-open traps, and the energy baseline for the steam SEU. This baseline becomes the reference point against which improvement is measured, satisfying Clause 6.5 (Energy baseline) requirements.
2. Ongoing monitoring and alert management: Each trap is monitored continuously against defined threshold criteria. Deviations from normal operating signature — acoustic emission increases above baseline for a thermodynamic trap, temperature differentials outside expected range for a float trap — generate alerts with timestamps. The alert record constitutes the measurement documentation required by Clause 6.6.
3. Repair documentation: When a failed trap is repaired or replaced, the work order and the post-repair telemetry confirmation (showing return to normal operating signature) create the documented evidence that improvement actions were taken and verified. This satisfies the EnMS requirement to demonstrate that energy performance improvement actions are tracked to completion.
4. Reporting for management review: Clause 9.3 requires management review of energy performance trends at defined intervals. Trap monitoring data aggregated into monthly or quarterly reports — showing the number of traps in each condition category, estimated steam losses, and comparison to baseline — provides exactly the format of information management review requires. The report is audit-ready without additional data assembly.
What This Does Not Replace
We are not saying that continuous trap telemetry eliminates the need for physical maintenance. Telemetry identifies failures and trends; physical inspection and repair are what actually fix traps. A monitoring system that generates alerts but lacks a clear repair workflow — who receives the alert, what the response time expectation is, how repair work orders are raised and closed — produces data without operational value.
The correct model is telemetry as the detection layer, with a maintenance workflow that acts on alerts within a defined response window. For a certified ISO 50001 site, that response window should be documented in the Measurement Plan itself: "Steam trap alerts are reviewed daily. Critical alerts (estimated loss >100 kg/hour) are responded to within 48 hours. Standard alerts are batched into the weekly maintenance schedule." That specificity is what makes the measurement plan defensible under audit.
Consider a process plant in the Finnish paper and board sector — a synthetic scenario but representative of the scale involved: a mill with 160 steam traps across its steam and condensate network, average steam generation of 22 t/hour at 8 bar, running three shifts continuously. At a 12% trap failure rate (plausible for a plant on an 18-month inspection cycle), approximately 19 traps are blown at any given time. At an average loss of 45 kg/hour per blown trap, that represents roughly 860 kg/hour of live steam loss — approximately 580 kWh/hour in fuel equivalent — running continuously, 24/7. That is over 5 GWh per year through trap failures alone. Continuous monitoring that catches each failure within a week of onset, versus 18 months of cumulative loss before the next walkthrough, represents a substantial and documentable energy performance improvement — exactly the kind of measurable outcome ISO 50001 auditors are looking for.
The measurement infrastructure that makes steam traps visible in a plant's energy data is the same infrastructure that makes the ISO 50001 evidence chain credible. They are not separate projects.